 Report Properties Dialog
The Report Properties dialog allows you to control many things about the report, including the page layout, optional bands, data grouping, variables, and how the ruler and grid appear.
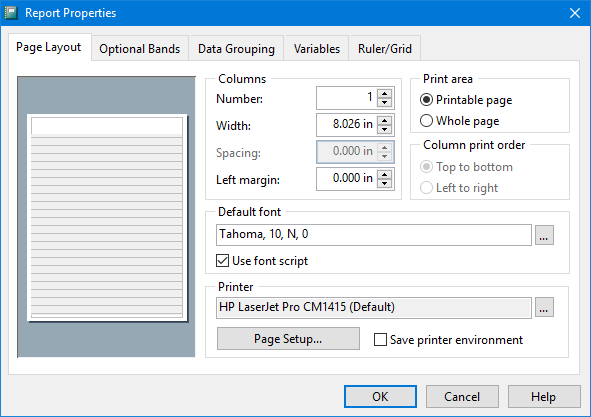
The Page Layout page allows you to control page layout settings. A miniature representation of the layout appears at the left. Some of the options in this page, such as Width and Spacing, are measured in the units chosen in the Ruler/Grid page.
This page has the following options:
Columns: Number: specifies the number of columns to print across the page.
Width: specifies the width of individual columns.
Spacing: specifies the space between columns. This setting is only available if there is more than one column.
Left margin: specifies the width of the left margin.
Print area: specifies how the minimum margins are determined. Printable page specifies that the layout uses the current printer's printable page dimensions and that printing begins immediately following the non-printable margin area. Whole page means the physical paper size of the current printer determines the dimensions of the layout.
Column print order: specifies how records are printed when you have multiple columns: top-to-bottom or left-to-right.
Default font: allows you to select the font name, style, size, and script for labels and fields. This font is used by default for any objects you add; it doesn't affect the font for existing objects.
Use font script: turn this option on to use the script selected in the font dialog in the report. This is only necessary in languages that use something other than Western script, such as Hebrew, Arabic, or Cyrillic.
Printer: displays the selected printer for the report. Note that this printer is only used if the Save print environment setting is turned on; otherwise, the report prints to whatever printer is current when the report is run. To change the selected printer, click the button with the ellipsis (...) beside the printer name.
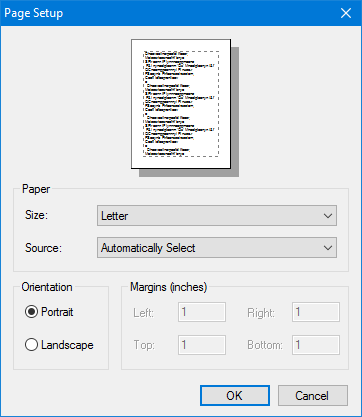
Page Setup: displays the Page Setup dialog, where you select printer and paper settings.
Save print environment: this item determines whether Stonefield Query stores the specific printer selected for the report or can use any printer. You can also control this setting with the Printer Environment function in the Report menu. This is best left turned off, but can be turned on if you want the report to always print to a particular printer.
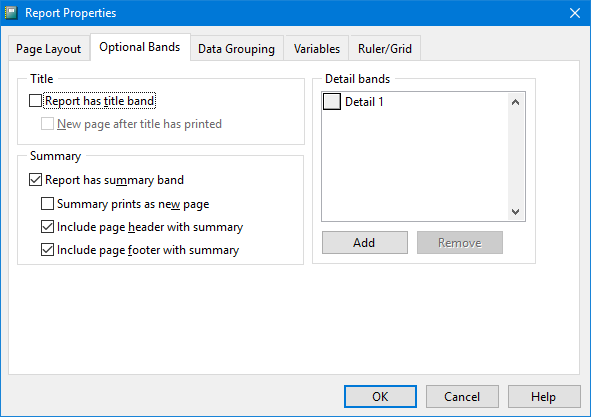
The Optional Bands page allows you to specify whether the report has title and summary bands, and how many detail bands are available.
The following options are available on this page:
Report has title band: turn this setting on to create a title band for the report. See the Report Bands topic for a description of the title band.
New page after title has printed: this setting, which is only available if the report has a title band, specifies whether the title band prints on its own page (if this setting is turned on) or not.
Report has summary band: turn this setting on to create a summary band for the report. Stonefield Query reports by default have this setting turned on. See the Report Bands topic for a description of the summary band.
Summary prints as new page: this setting, which is only available if the report has a summary band, specifies whether the summary band prints on its own page (if this setting is turned on) or not.
Include page header with summary: this setting, which is only available if the report has a summary band, indicates whether, if the summary band prints on its own page because there isn't enough room for it at the bottom of the last page, the page header is printed on that page.
Include page footer with summary: this is similar to the previous setting, but determines whether the page footer is printed when the summary band appears on its own page.
Detail bands: a report normally has only one detail band, but under some conditions, having more than one detail band can be useful. This option shows the detail bands used in the report.
Add: click this button to add a new detail band to the report.
Remove: click this button to remove the selected detail band from the report.
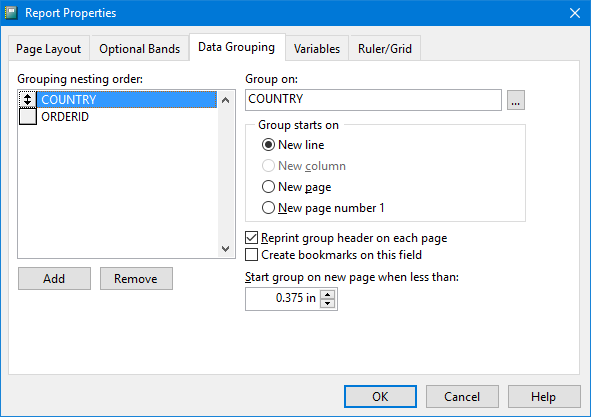
The Data Grouping page specifies how data is grouped in the report. Grouping on City, for example, means that customers for a particular city are printed, and when the city changes, a group break occurs. When a group break occurs, the group footer band for the group is printed, then the group header band for the next city is printed, and then the customers for the next city are printed.
Data groups are nested, so one group exists inside another. For example, you may have a group on Country, and within it, a group on Region, and within that, a group on City.
This page has the following options:
Grouping nesting order: displays a list of the data grouping expressions in the order they are nested. To change the order of the data grouping, click the button in front of a group name and drag it up or down in the list to the desired new location.
Add: creates a new data group at the bottom of the nesting order. Clicking this button displays the Expression Builder dialog in which you enter the expression for the data group. The expression is normally a field, but can also use built-in functions. For example, LEFT(CompanyName, 1) gives the first character of a company name, so using this as a data group expression prints all the companies starting with "A," then the ones starting with "B," and so on.
Remove: removes the selected group.
Group on: the data grouping expression. Once you've created a data group, you can change the expression by typing in the text box or clicking the button beside the box (the "..." button) to display the Expression Builder.
Group starts on: this setting allows you to specify where a new group starts. The default is New line, which starts the group on the next line in the report. New column, which is only available if you specify more than one column for the report in the Page Layout page, indicates that the report continues in the next column. New page causes each group to start on its own page; New page number 1 is similar but restarts the page numbering at 1 for each group.
Reprint group header on each page: turn this setting on to print the group header band again when the group flows onto another page. With this turned off, the group header band only prints once, at the start of the group.
Create bookmarks on this field: if this option is turned on, the different values of this field are displayed in a table of contents when the report is previewed or output to PDF or HTML. You can jump to the appropriate place in the report by clicking an item in the table of contents.
Start group on new page when less than: this specifies the minimum amount of room you want at the bottom of the page before starting a new group. If the amount of space available is smaller than this value, the group starts on the next page. Setting this value to something greater than 0 prevents the case where the group header prints at the bottom of the page without any of the group members appearing because there isn't room.
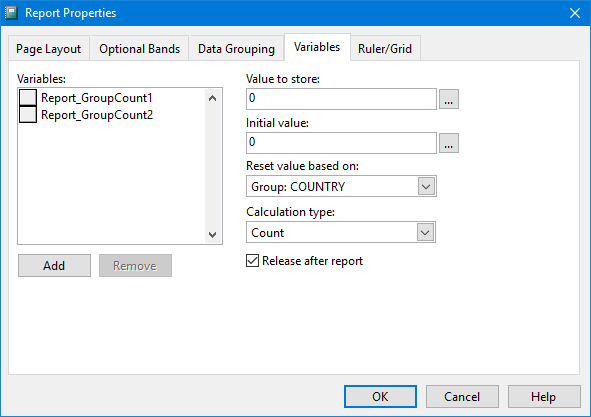
The Variables page allows you to define report variables. See the Variables help topic for more information on variables.
The following options are available for variables:
Variables: this list shows the variables defined for the report. To select a variable for editing or removing, click its name in the list. Variables are evaluated in the order they appear in the list. This is normally only important if one variable references another variable in its Value to store or Initial value settings. To change the order, click the button in front of the variable to move and drag the button up or down in the list.
Add: click this button to add a variable. You're prompted for a name. Variable names must start with a letter and contain only letters, numbers, and underscores (that is, no spaces or punctuation).
Remove: click this button to remove the selected variable.
Value to store: the value or calculation to store to the variable for every record. It could be the name of a field, a constant value (such as 1), or an expression. Click the Expression Builder button to display the Expression Builder as an easier way to enter an expression.
Initial value: the variable's value before any calculations are performed, and the value to which the variable is reset. This defaults to 0. Click the Expression Builder button to display the Expression Builder as an easier way to enter an expression.
Reset value based on: allows you to specify the point at which the variable is reset to its initial value. By default, Report is displayed, meaning the variable retains its value until the end of the report. You can also select Page or Column, indicating that the variable is reset at the end of each page or column. If there are any groups in the report, this option displays an item for each group. If the report has more than one detail band, this option displays an item for each band.
Calculation type: this option allows you to specify a calculation that the variable performs. The variable begins calculating with its initial value, and continues until it is reset to this initial value. The choices are:
None: no calculations are made on this variable.
Count: counts the number of times a variable is printed per group, page, column, or report (depending on your selection in the Reset list). The calculation is based on the number of times the variable occurs, not on the variable's value.
Sum: computes the sum of the variable's values. This option keeps a running total of the values for a group, page, column, or report (depending on your selection in the Reset box).
Average: computes the arithmetic mean (average) of the variable values within a group, page, column, or report (depending on your selection in the Reset box).
Lowest: determines the lowest value that occurred in the variable for a group, page, column, or report (depending on your selection in the Reset list).
Highest: determines the highest value that occurred in the variable for a group, page, column, or report (depending on your selection in the Reset box).
Standard deviation: returns the square root of the variance for the variable values within a group, page, column, or report (depending on your selection in the Reset box).
Variance: measures the degree to which individual variable values vary from the average of all the values in the group, page, column, or report (depending on your selection in the Reset box).
Release after report: specifies that the variable is released after the report has run. This should normally be turned on, but can be turned off if you want to use the value of the variable in AfterRun code.
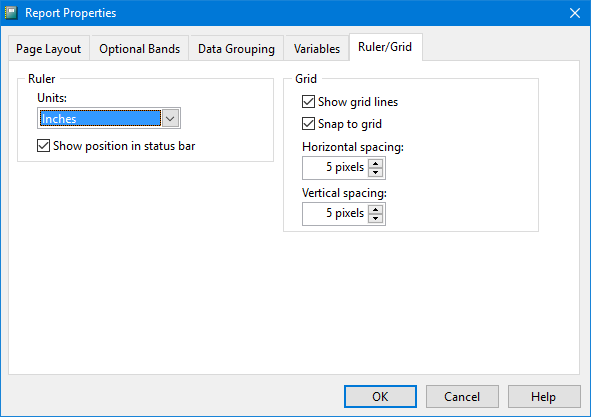
The Ruler/Grid page is used to define the horizontal and vertical increments of the grid and the scale of the ruler. This page has the following options:
Units: specifies the scale of the ruler. The choices are "Inches (no ruler)," "Inches," "Metric/cm," and "Pixels."
Show position in status bar: if this option is turned on, the size and position of the selected report object are shown in the Advanced Report Designer status bar at the bottom of the screen.
Show grid lines: turn this setting on to display grid lines in the Advanced Report Designer.
Snap to grid: if this option is turned on, objects can only be moved or sized in grid-sized increments. Turn this option off to allow objects to be moved or sized in as small as one pixel increments.
Horizontal spacing: the horizontal spacing of the grid in pixels.
Vertical spacing: the vertical spacing of the grid in pixels.
© Stonefield Software Inc., 2026 • Updated: 12/16/16
Comment or report problem with topic