 Outputting to a Data Grid
Sometimes you just want to see the results of a report without needing it formatted nicely. The fastest way to see the results is to output to a Data Grid. Click the Data Grid button in the ribbon or the toolbar, choose Data Grid from the File menu, or right-click a report and choose Data Grid from the shortcut menu, to retrieve the data from the report and display a data grid dialog.
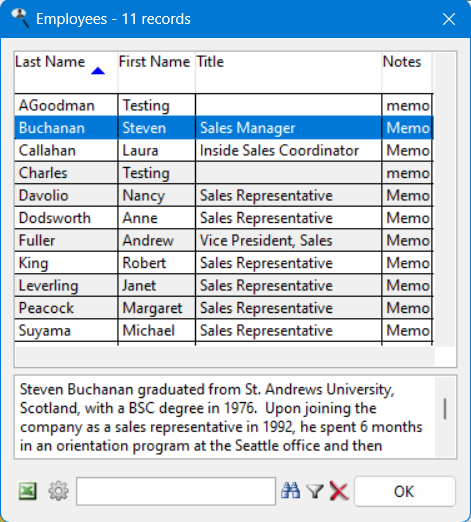
The dialog has the following features:
If there's a memo field in the data grid, its content for the selected record is shown in a text box below the grid. If there's more than one memo field, the content of the selected memo is shown. You can control the relative size of the grid and the text box by dragging the area between the two (the "splitter") up or down.
You can resize a column by dragging the vertical bar at the end of its column header left or right.
You can auto-size a column by right-clicking its column header and choosing Auto-size This Column from the shortcut menu. When you resize the dialog, that column is automatically resized.
You can auto-fit the columns to match the currently displayed records by right-clicking any column header and choosing Auto-fit Grid from the shortcut menu.
You can rearrange the columns by dragging a column header left or right.
You can sort a column by clicking its column header.
 appears in the header indicating the column is sorted in ascending order. Click the header again to sort in descending order and display
  . The mouse pointer displays as an up arrow (sort ascending), down arrow (sort descending), or "no" symbol (column cannot be sorted) when it's over a column header.
Type some text in the search box near the bottom and click the
 button to find the first record containing that text in any field. Click that button again to find the next record.
Type some text in the search box and click the
 button to filter on that text.
Click the
 button to clear the search and filter.
Click the
 button to output to Microsoft Excel.
Press the Home key to jump to the first record or the End key to jump to the last one.
Logical (yes/no) fields display as check boxes.
The grid can optionally display rows in alternating colors, known as "zebra stripes" (see below).
Click the
 button to display the Options dialog.
The Options dialog has the following settings. Note that these settings are not report-specific but are user-specific.
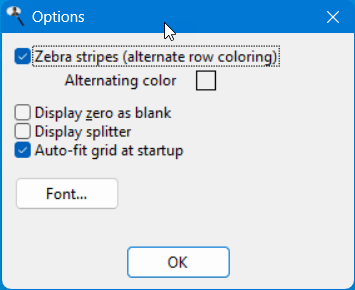
Zebra stripes: turn this on to display rows in alternating colors.
Alternating color: click this to select the color to use for alternate rows.
Display zero as blank: if you turn this option on, a blank is displayed rather than a zero value.
Display splitter: turn this on to display the splitter between the grid and the text box visually rather than just as a grey area.
*Auto-fit grid at startup": turn this setting on to auto-fit the grid to the column widths when the form opens.
Font: click this button to select the font and size for the grid.
© Stonefield Software Inc., 2026 • Updated: 11/24/23
Comment or report problem with topic