Stonefield Query comes with several pre-defined reports and labels. To add any of these to your list of reports, choose the import report function, move into the Reports subdirectory, and select the desired report. The following files come with Stonefield Query.
AP Reports
- Top Purchases by Vendor: This report shows the top purchases by vendor for a specified time period.

Labels
- Company Mailing Labels: This label prints the company name, contact name, two lines of address, and city/state/zip for customers.

Contact Mailing Labels: Similar to Company Mailing Labels except the contact name appears on the first line rather than the company name.
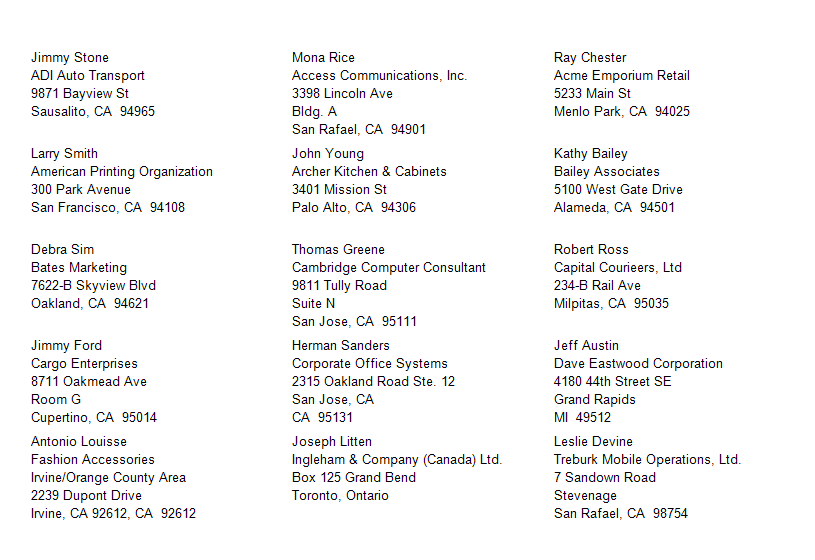
Employee Mailing Labels: This label prints the name, two lines of address, and city/state/zip for employees.
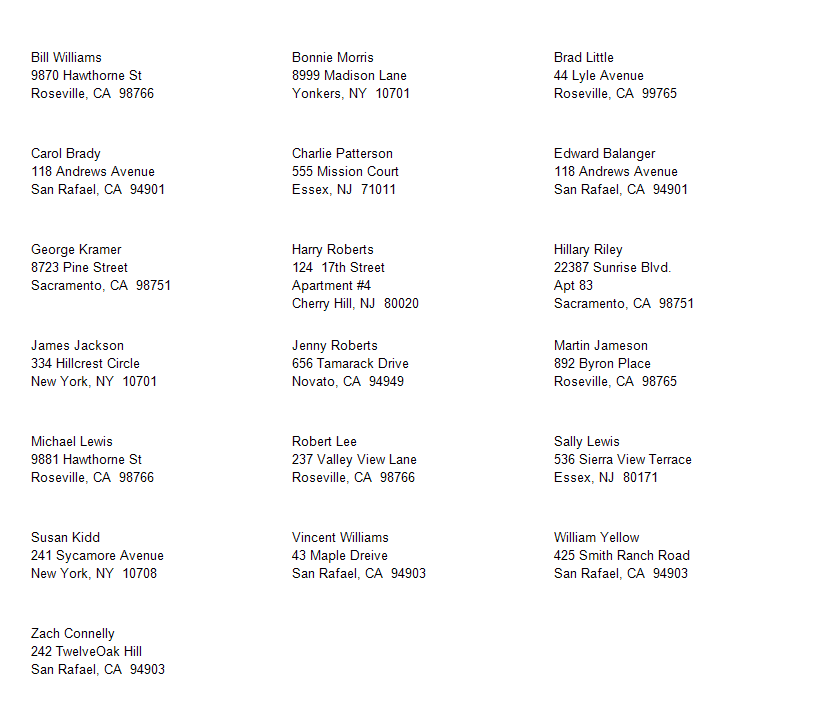
Vendor Mailing Labels: This label prints the company name, contact name, two lines of address, and city/state/zip for vendors.

New in Version 4
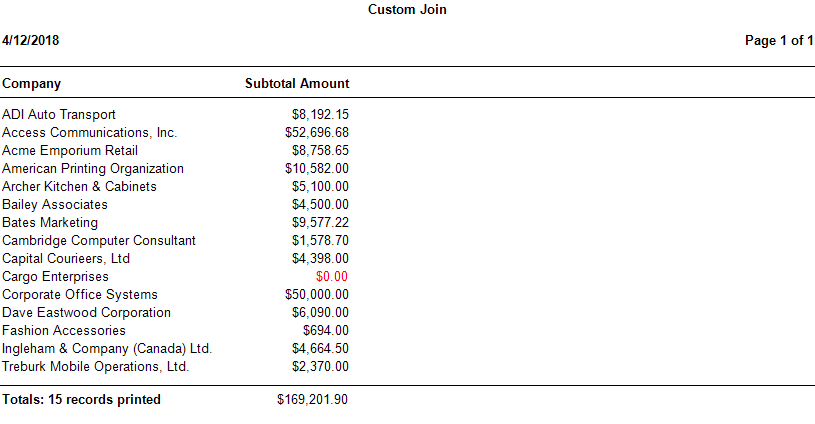
Custom Join: This report uses a custom join to show all customers whether they have invoices or not. Those customers with no invoices will be highlighted in red.
Customer Who Bought One Year But Not Another: This report shows a new feature with exclusion conditions: they can now use fields from tables involved in the report. It shows those customers who bought something in 2009 but not in 2010.

Date in Row: This cross-tab report shows how dates can be formatted in row fields as year, quarter, month, and so on. It also shows how templates can format the totals differently that the rest of the data.

Gradients: This is a simple list of customers but also shows how gradients can be used in templates.

Most Recent Invoice: This uses the new highest summary type for date fields to show the most recent invoice for each company.

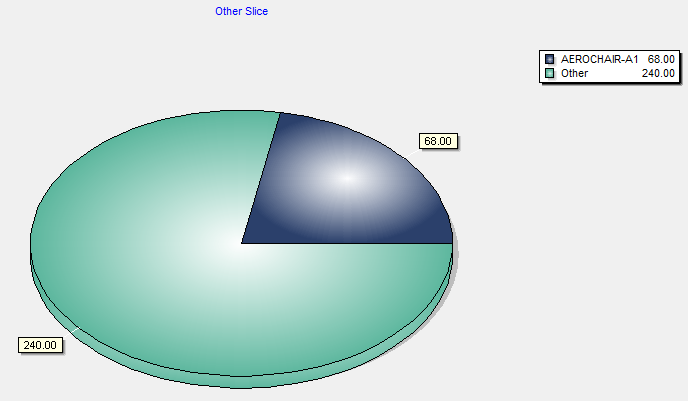
Other Slice: This chart shows the new "other" slice in pie charts that combines smaller values into a single group.
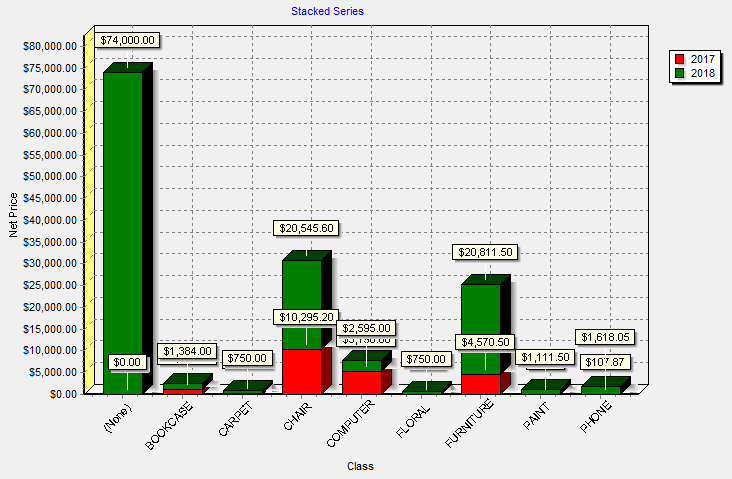
Stacked Series: This chart shows the new stacked series option.
New in Version 4.1
% Change: This report shows the new amount and percentage difference features.

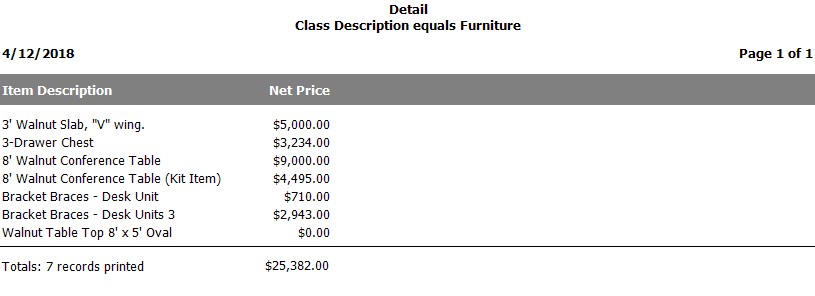
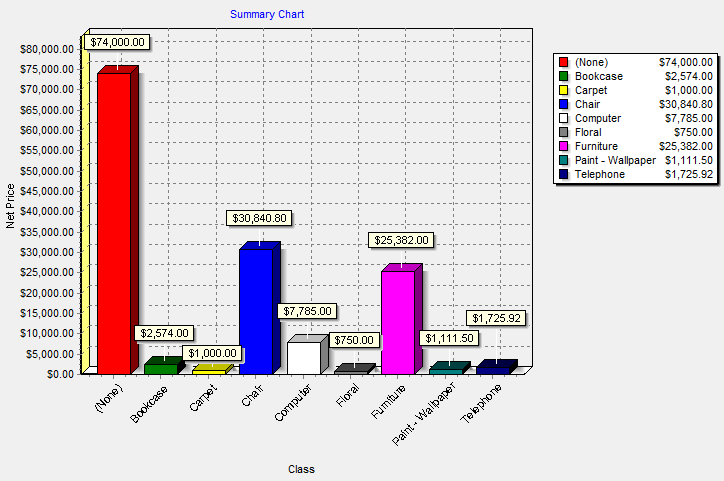
Detail: This is the drilldown detail report for the Summary Chart report.
Freight by Date Chart: This shows a multi-paged chart.

My Dashboard: This is an example of the new dashboard feature.
Product Sales by Customer: This is a drilldown from Sales by Product.

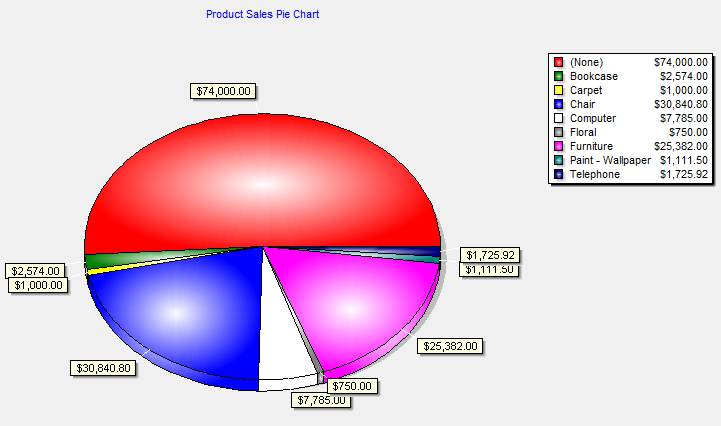
Product Sales Pie Chart: This is a top-level report that drills down to the Sales by Product chart, which then drills down to the Product Sales by Customer report.
Sales by Month and Year: This report shows the new Month format for dates and also has "row totals" turned off.

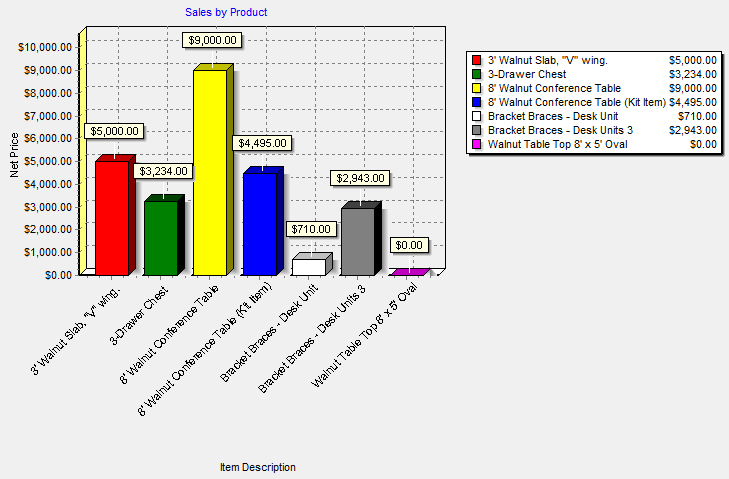
Sales by Product: This is a drilldown from Product Sales Pie Chart, and it in turn drills down to the Product Sales by Customer report.
Summary Chart: This report shows how drilldowns from charts work. This links to the Detail report.
New in Version 5.2
Background Color: This report shows support for background color for fields.
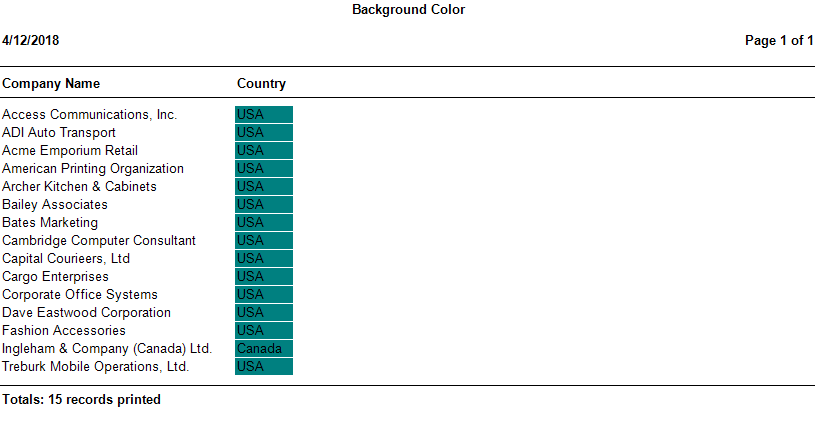
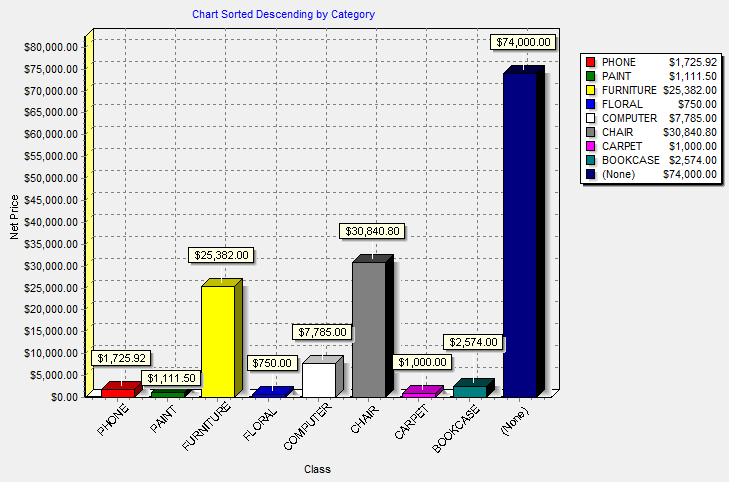
Chart Sorted Descending by Category: This report shows that charts can now be sorted in descending order by a category (X-axis) or series field.
Dashboard Including Quick Report: This report demonstrates that dashboards can now include quick and cross-tab reports.

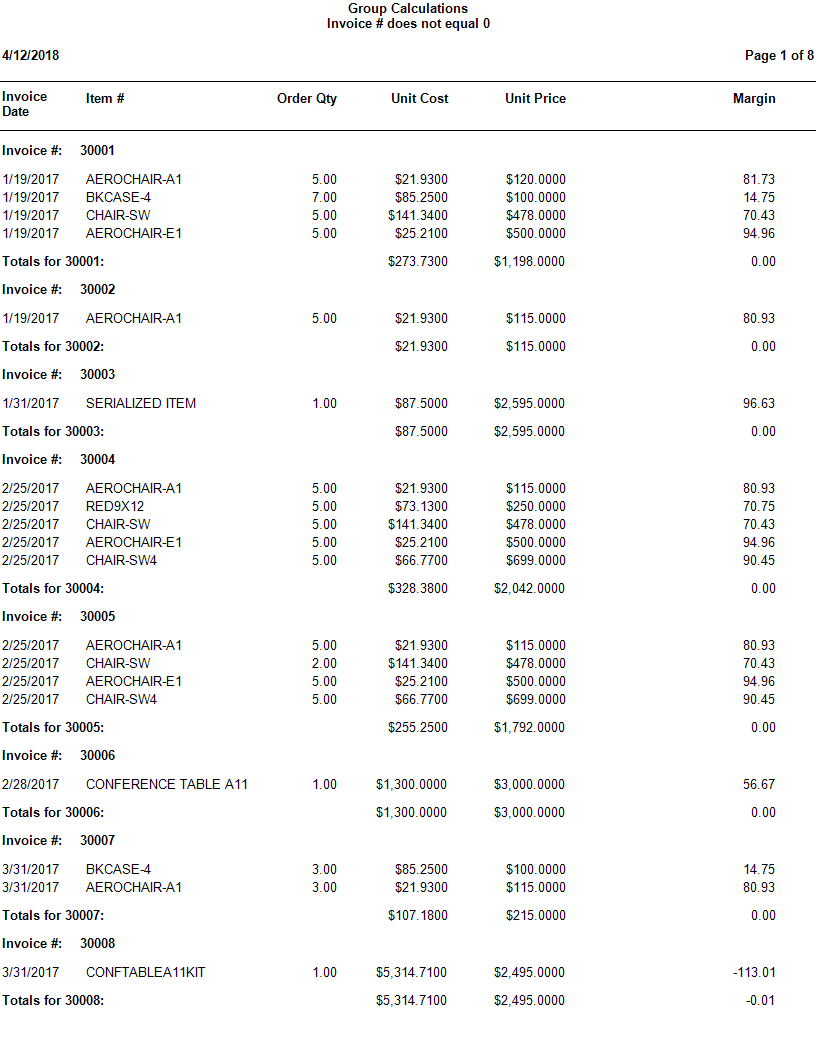
Group Calculations: This report shows how a formula can be re-calculated at the group level. Margin, which is (Price - Cost) / Price as a percentage, can be calculated for each item, but it's complicated calculating the margin for an invoice; you can't sum or average the margin for each item, but instead have to calculate at the invoice level. The new Calculate Value at Group Level setting for formulas makes this easy.
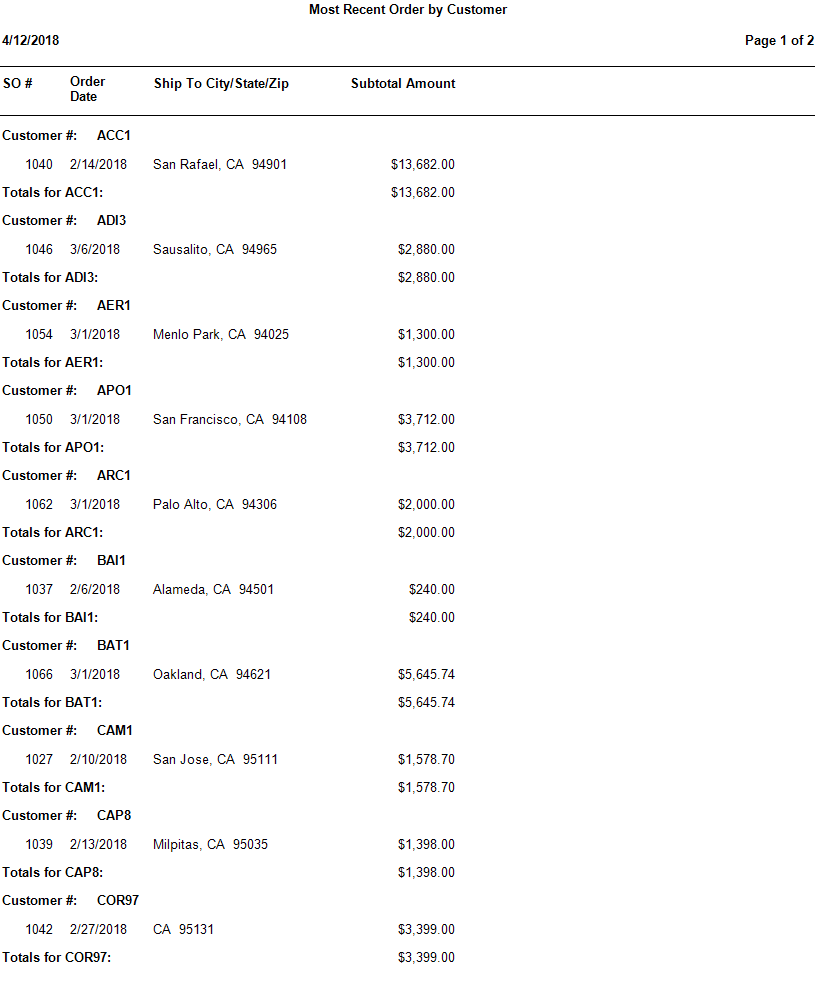
Most Recent Order by Customer: This report shows how the new Number of Records per Group setting allows you to retrieve just the most recent order for each customer.
New in Version 6.0
Customer Contacts Subreport: This is used as a subreport of Customers Parent to show which contacts belong to the current customer.

Customers Parent: This report uses subreports to show which contacts and invoices belong to each customer. It also shows the new Stylish Blue template.

Invoices Subreport: This is used as a subreport of Customers Parent to show which invoices belong to the current customer.
Batch Report with Multiple Ask-at-Runtimes: This batch report includes two reports that have ask-at-runtime filter conditions on Invoice Date, but when you run the report, you're only asked once for the date range and those values are used for both reports.
Details for Linked Gauge: This is the report the Linked Gauge Report links to. It also shows the new Stylish Green template.
Linked Gauge Report: This report shows how a gauge can link to another report and the new marker feature.
New in Version 7.0
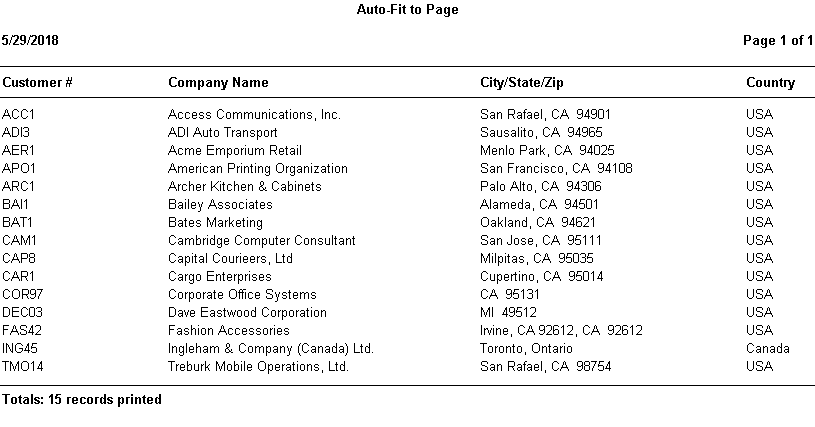
Auto-Fit to Page: Auto-fit to page now spreads fields evenly across the page by adding additional space between columns.
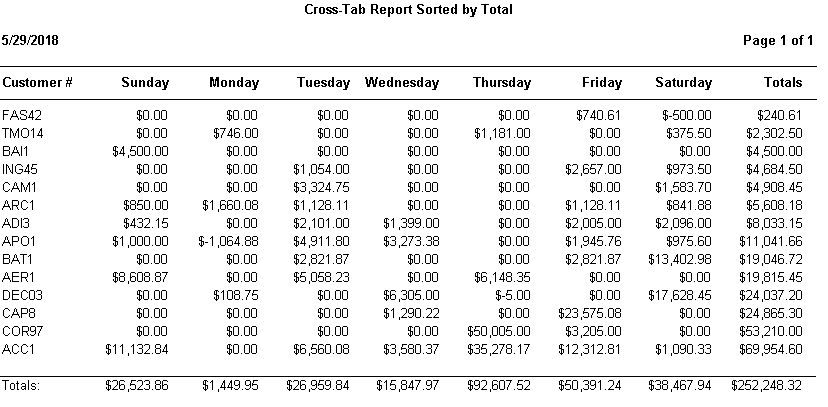
Cross-Tab Report Sorted by Total: Cross-tab reports can now be sorted on the total of the data field. This report also shows the new Day display type for date fields.
Cycling Dashboard: You can now specify the number of columns to display in a dashboard. If the total number of cells (rows multiplied by columns) is less than the number of reports, the reports are cycled through in sets at the specified interval.
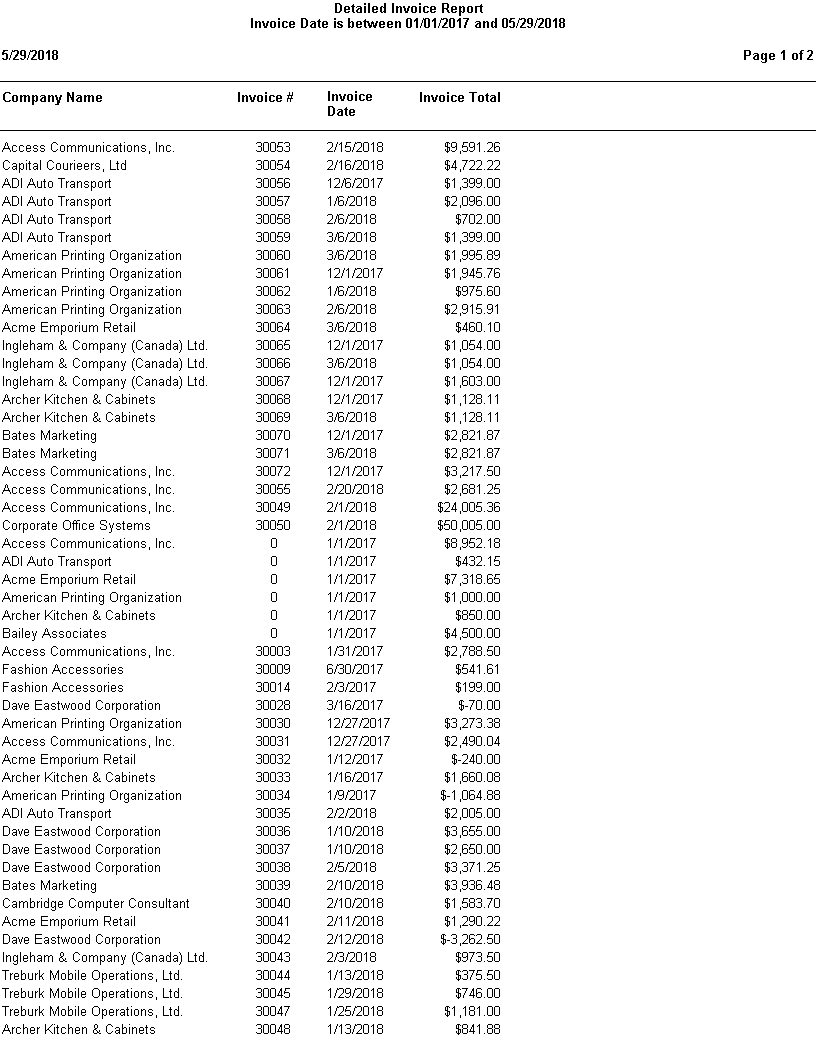
Detailed Invoice Report: This report is drilled down to from the Invoice Summary Chart report. It shows how you can drill down from an aggregate date, such as Quarter, to a date range.
Invoice Summary Chart: This chart drills down to the Detailed Invoice Report report. It shows how you can drill down from an aggregate date, such as Quarter, to a date range.

Min/Max for Gauge: This report shows how you can set the minimum and maximum values for a gauge.

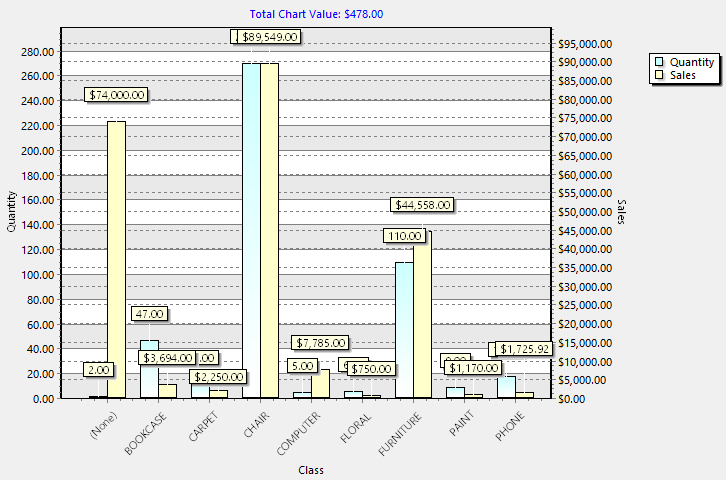
Right Axis Title: This report shows how you can set the right-axis title for a chart and have the legend display the titles rather than field headings. It also shows how to display the total value for the chart in a title.
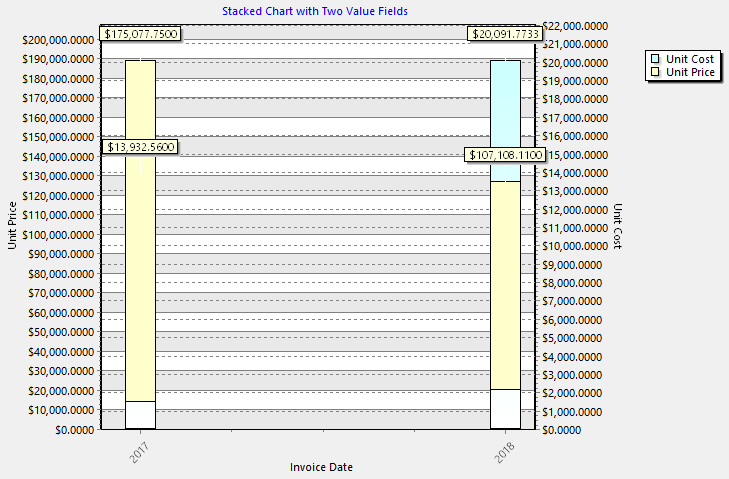
Stacked Chart with Two Value Fields: This report shows how you can create a stacked chart with two value fields and no series field.
Value in Custom Filter Description: This report shows how the placeholder in the custom description of a filter condition displays the value entered by the user.

Sample Reports
AR Open Credit Report: Listing of current open credits.

AR Open Invoices: Listing of current open receivables.

AR Revenue Report: This report displays the total revenue generated for each item shipped during a selected period of time by customer.
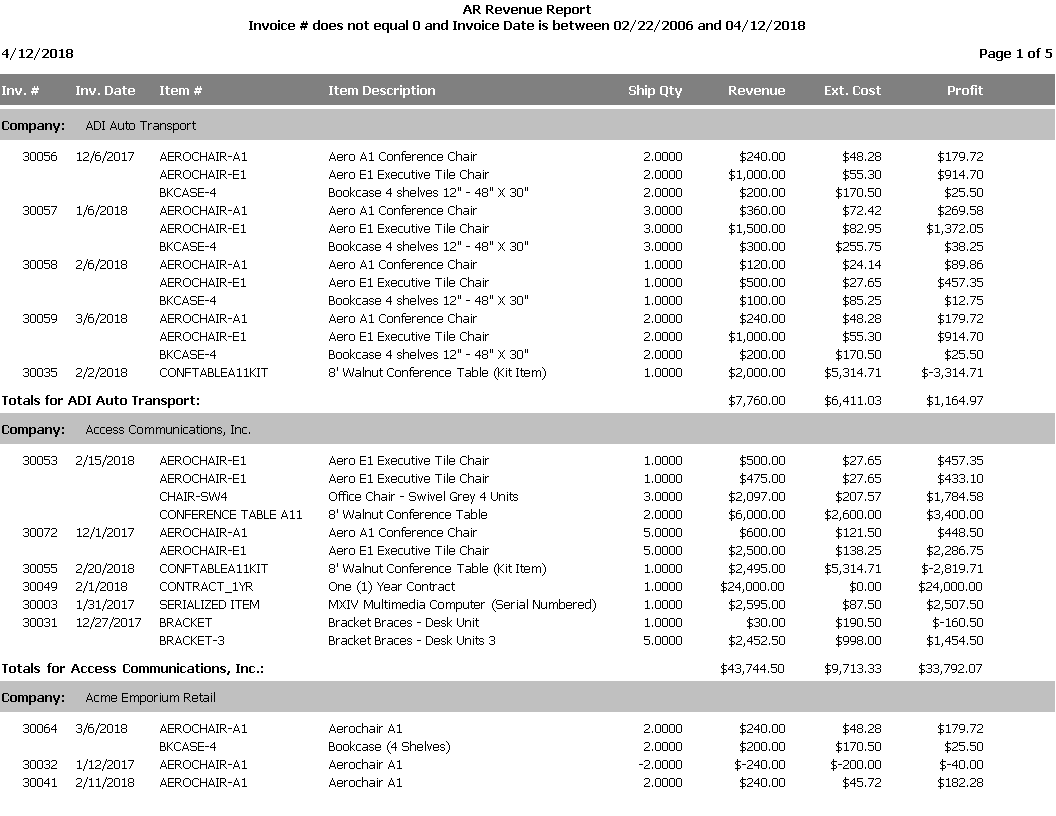
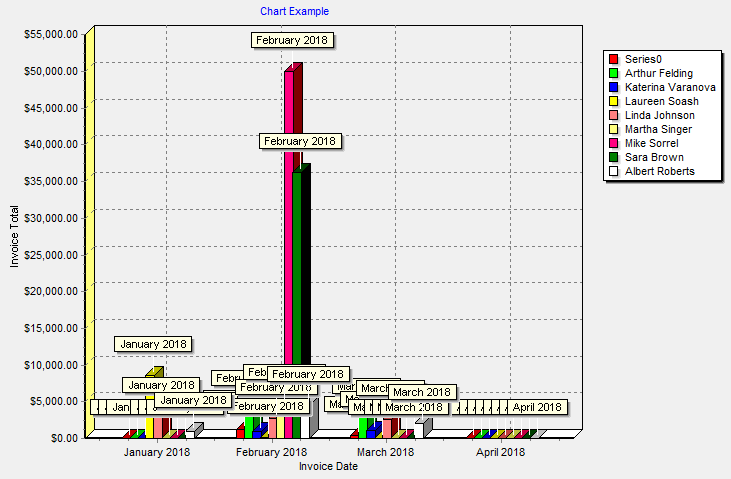
Chart Example: An example of the new charting feature. This is a bar chart of AR Invoice totals by Salesperson, broken up in to months.
Drilldown Example - Child: An example of the new Drilldown capability of Stonefield Query. This is the child report, which gets called by the parent when a particular customer is clicked.
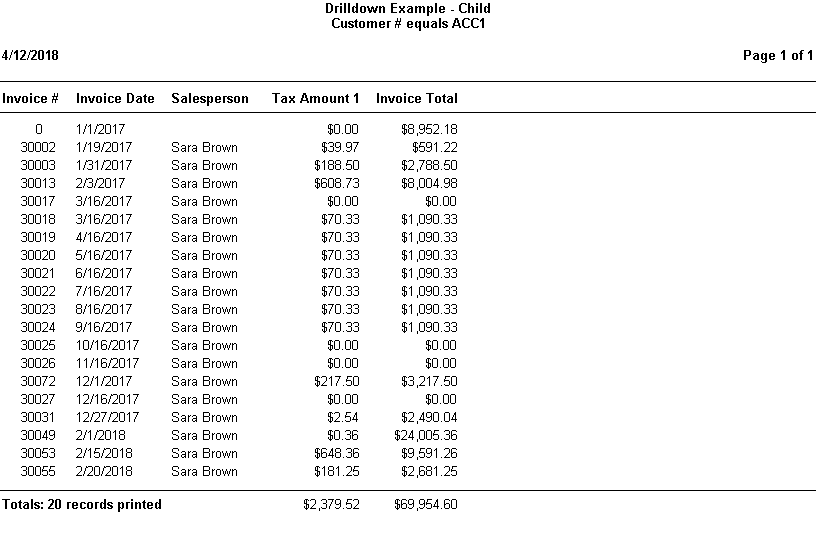
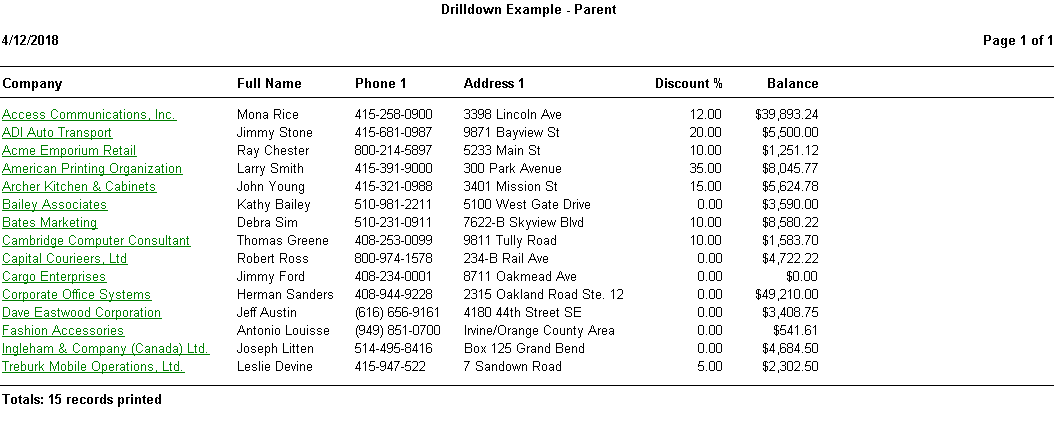
Drilldown Example - Parent: An example of the new Drilldown capability of Stonefield Query. This is the parent report, so run this first, and click a customer to 'drill down' in to a list of invoices for that customer.
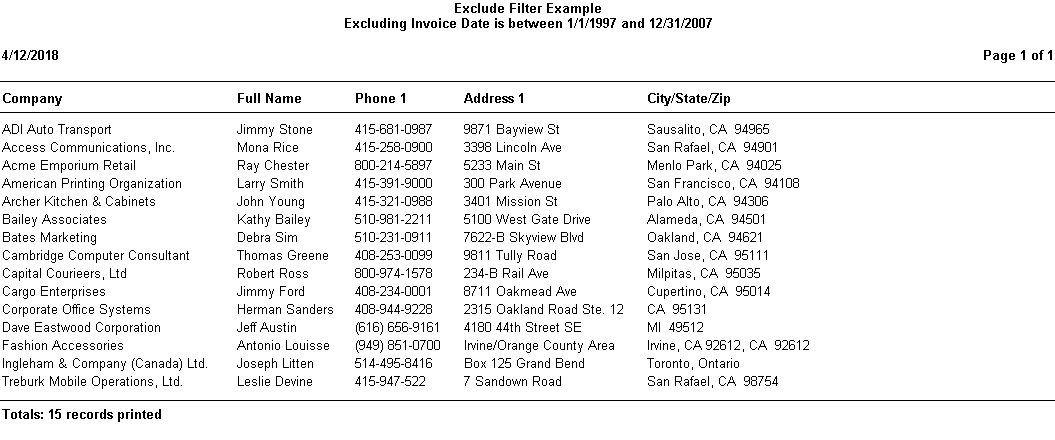
Exclude Filter Example: Using an exclude filter, show all of the customers who haven't ordered anything in the past 10 years (customers with invoices).
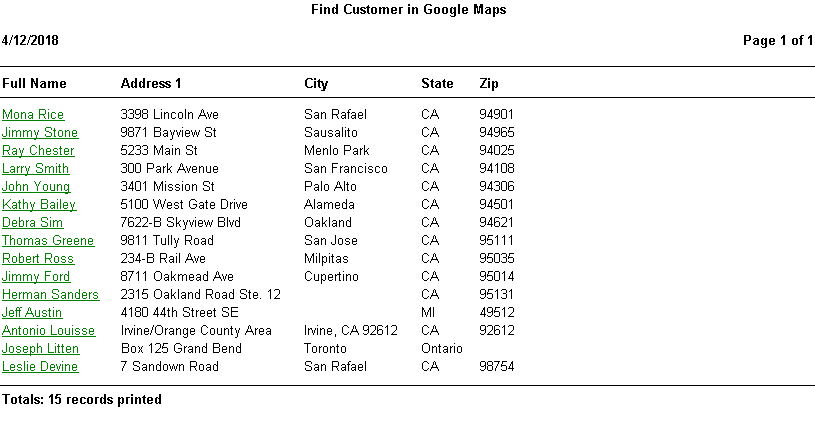
Find Customer in Google Maps: Locate a customer from AR in a Google Map
Find Employee in Google Maps: Locate an employee from PR in a Google Map

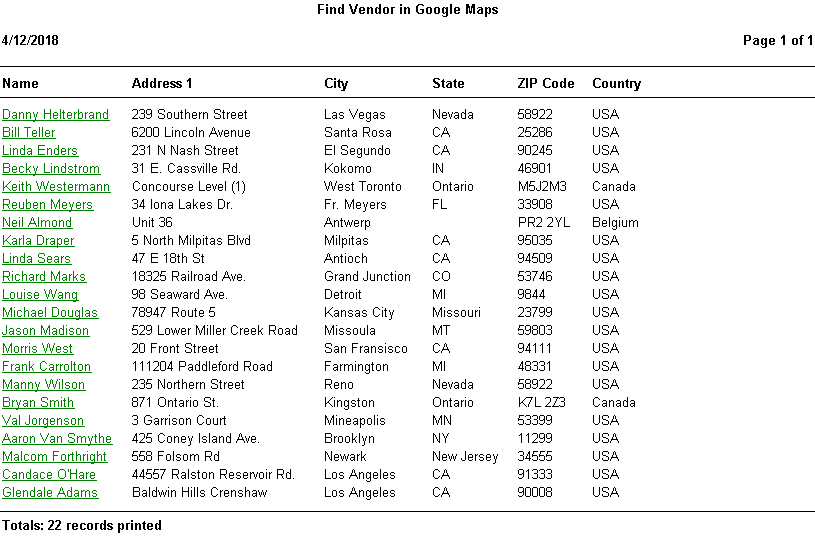
Find Vendor in Google Maps: Locate a vendor from AP in a Google Map
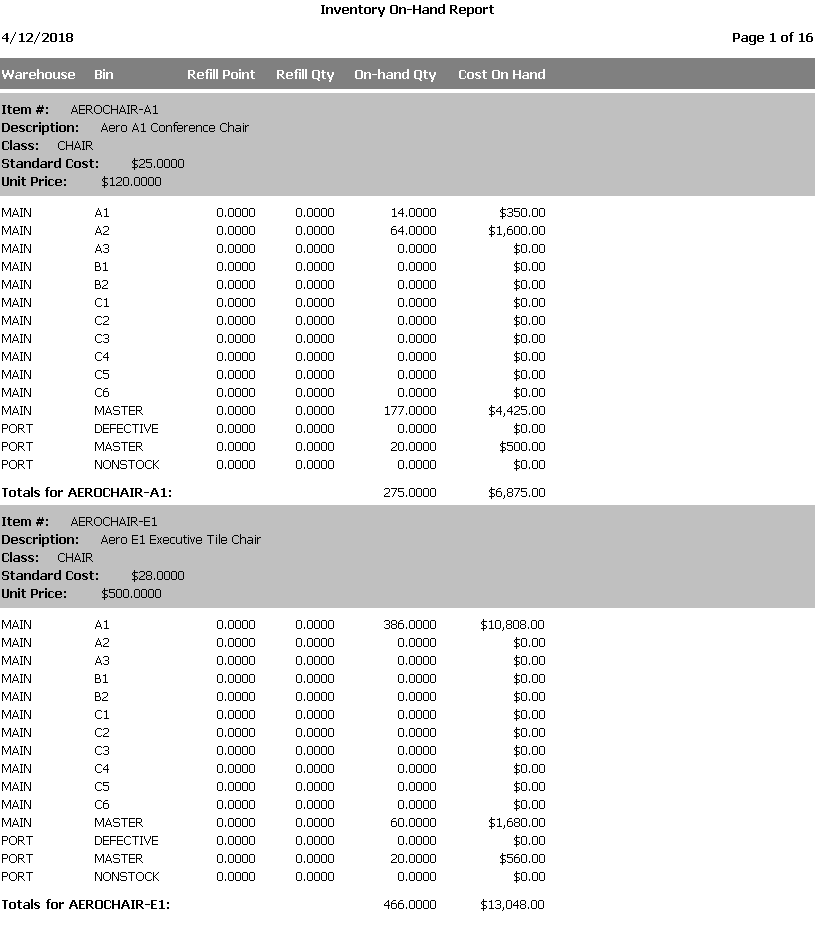
Inventory On-Hand Report: This report shows the on-hand amounts for each item by warehouse.
Top Sales Reports
Most Profitable Customers (Profit Amount): This report displays the most profitable customers based on the profit amount.
.png)
Most Profitable Customers (Profit Margin): This report displays the most profitable customers based on the profit margin.
.png)
Most Profitable Items (Profit Amount): This report displays the most profitable items based on the profit amount.
.png)
Most Profitable Items (Profit Margin): This report displays the most profitable items based on the profit margin.
.png)
Top 10 Sales by Item Annually: This report shows the top 10 sales by item based on order quantity in a given year.

Top 10 Sales by Item Monthly: This report displays the top 10 sales by item based on order quantity in a given month.

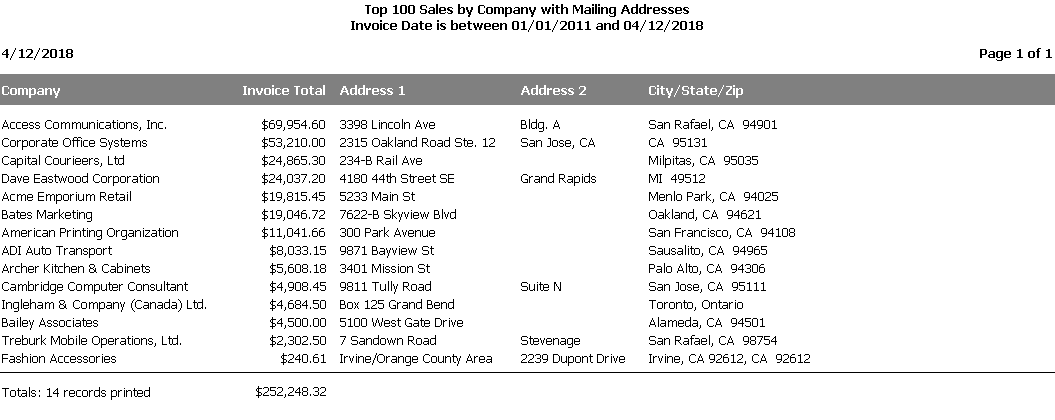
Top 100 Sales by Company with Mailing Addresses: Top sales by Customer for a specified time period. Report includes mailing addresses.
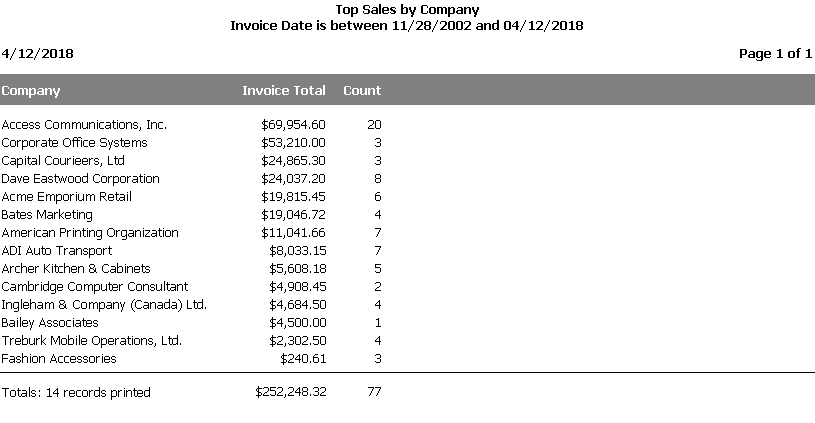
Top Sales by Company: This report shows the top sales by customer for a specified time period.
Top Sales by Item (Order Qty): This report shows the top sales by item based on the order quantity.
.png)
Top Sales by Item (Total Sales): This report shows the top sales by item based on the total sales.
.png)
© Stonefield Software Inc., 2025 • Updated: 03/27/24
Comment or report problem with topic
 Pre-Defined Reports and Labels