 Examples
Let's create an advanced layout for the opportunity report we created in Lesson 1 of the tutorial. First, click this report in the Reports Explorer and choose Edit. Click Next to go to Step 2. We'll need a bit of extra space, so choose the Stage field in the selected list and then click the left arrow to remove it from the report. Also, set the widths for the Contact and Opportunity fields to 25 and 30 respectively, using the Properties button. Then click Next three times to go to Step 5. Set the Orientation to Landscape, then check the Advanced Layout box, and click Edit. You'll be asked whether the report objects should be auto-fitted for width; choose Yes.
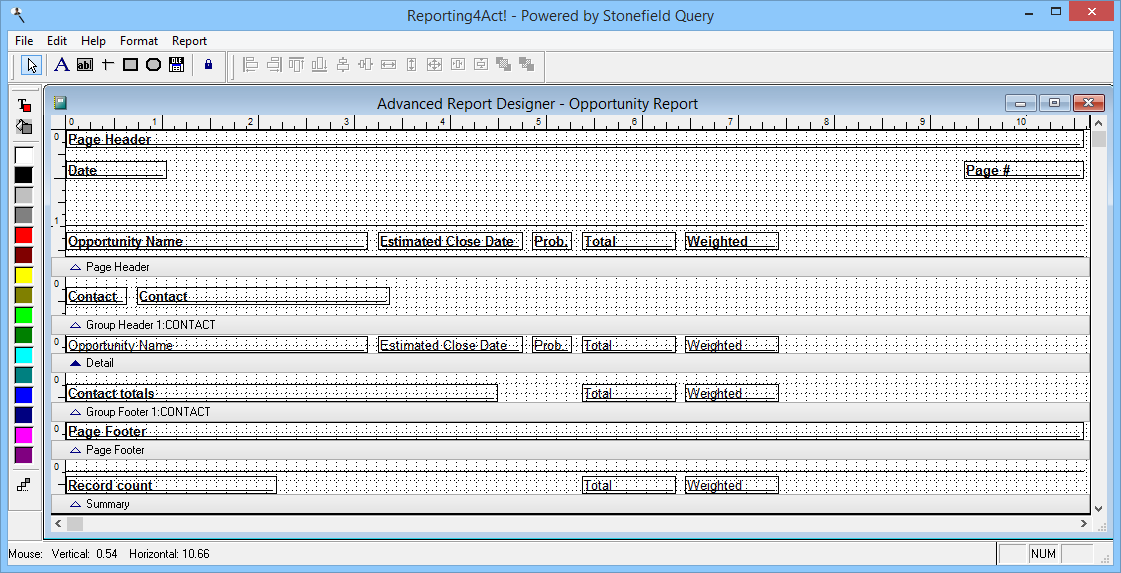
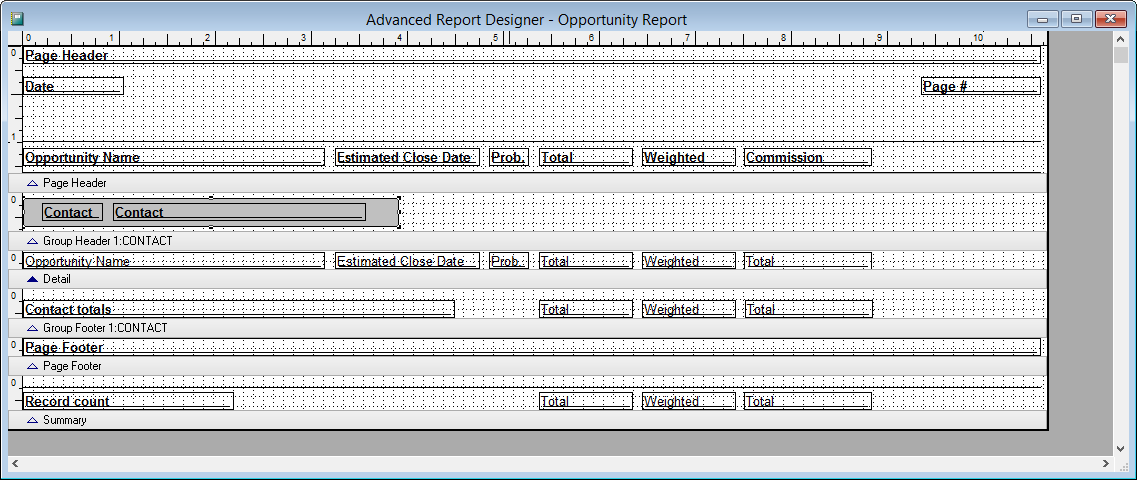
The Advanced Report Designer should appear as shown below.
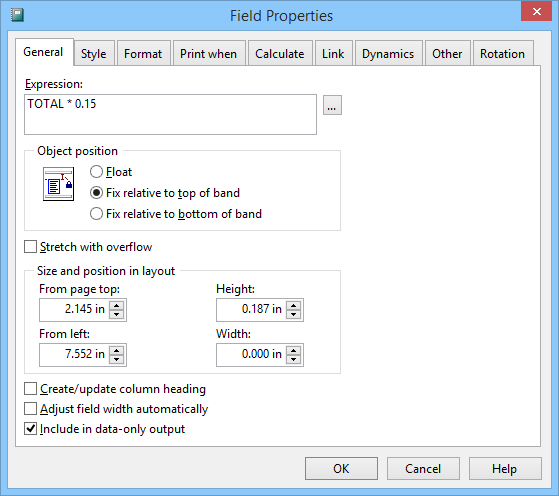
Let's start by adding a commission field. For our example, we'll use a commission rate of 15%. Click the field button ( ) in the toolbar, and then click in the Detail band, just to the right of the Weighted field. This should bring up the Report Expression window. Click the Expression Builder button to the right of the Expression property. Choose Contact Opportunity from the Table drop-down list and double-click the Total field in the Available Fields list. Add
 * 0.15 to the expression so it appears as {Total (Contact Opportunity)} * 0.15. Click OK. Select the Format page of the Field Properties dialog and type 999,999.99 in the Format text box, and set the data type to Numeric. These entries tell Reporting4Act! what to print in this field (0.15 times the Opportunity Total field), and how to format it (with two digits after the decimal place). Turn on the Create/update column heading option, and click OK.
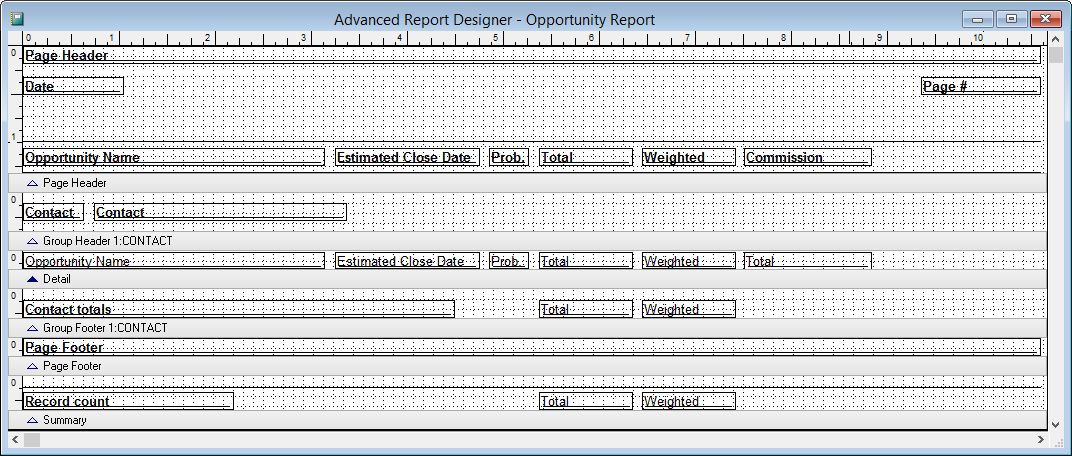
Although Reporting4Act! automatically created a column heading for this field, we want a different heading, so double click it and change "Total" to "Commission" (including the quotation marks). You should now have a report layout like this:
It would be nice to have a sum for the Commission field beside those for the Total fields. To create one, copy the new Total field and paste, then move the copy to the Group Footer band. Double-click the field and on the Calculate page, change the Calculate Type to Sum. Do the same thing in the Summary band, but make sure the Reset Based On option is set to Report. Now, let's preview our report. Close the Advanced Report Designer window, click Yes on the Do you want to save changes prompt, and click Preview in the wizard.
Let's add a grey rectangle in the group header to make it stand out. Click the Edit... button in the wizard to open the Advanced Layout Designer again. To make room for the rectangle at the left, select all objects in the group header band by holding down the Shift key and double-clicking the grey bar for the band, then click one of them and drag slightly to the right. Now click the Rectangle object ( ) in the Report Controls toolbar, click near the upper left corner of the group header band and drag to the lower right corner to draw a rectangle. Click the Background button (
 ) in the Color Palette, then click the light grey button to make that the fill color for the rectangle. Oops, the rectangle now completely covers the labels and fields in the band. Click the Send to Back button (
 ) to move the rectangle behind the other objects. The report should now look like this:
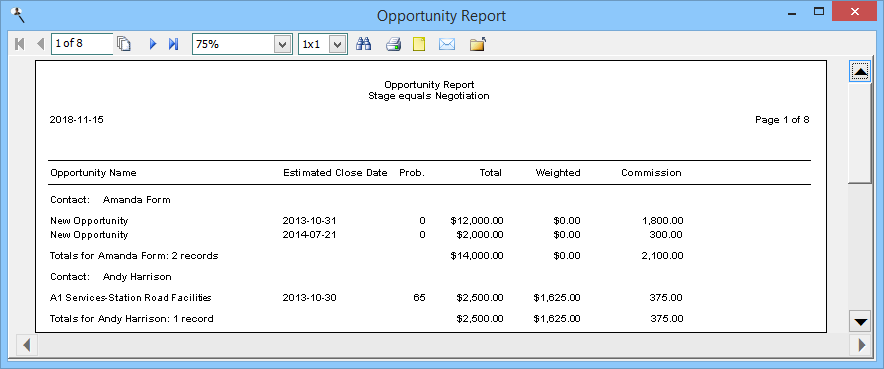
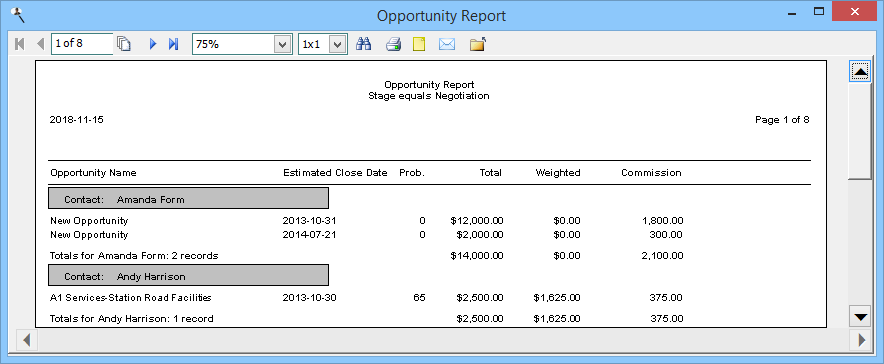
Save the report and preview again. Here's the finished product:
© Keystroke.ca, 2026 • Updated: 08/29/18
Comment or report problem with topic