The Essential Reporting Solution for AccountMate Users
Download Trial Watch video Schedule Demo View documentation
Stonefield Query for AccountMate is quite simply the most powerful, easy-to-use reporting product on the market for your AccountMate data.
Stonefield Query provides a step-by-step method to create professional business reports from information stored in AccountMate. Anyone can create detailed reports, high level overview, drill-down, charts/graphs, pivot tables, and more in minutes rather than hours.
We Know AccountMate
Stonefield Query knows the AccountMate database structure, and has been delivering industry-leading reporting solutions for years. It has the following special features:
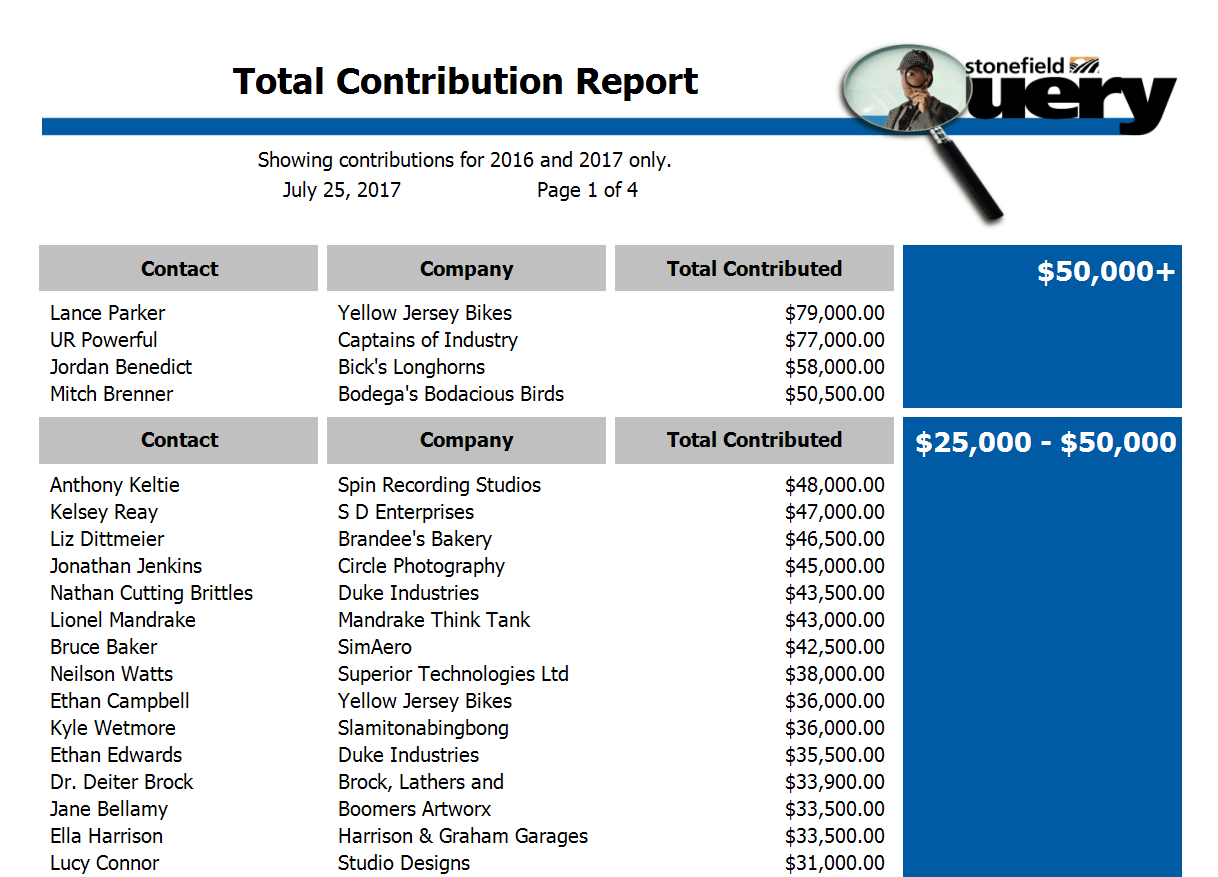
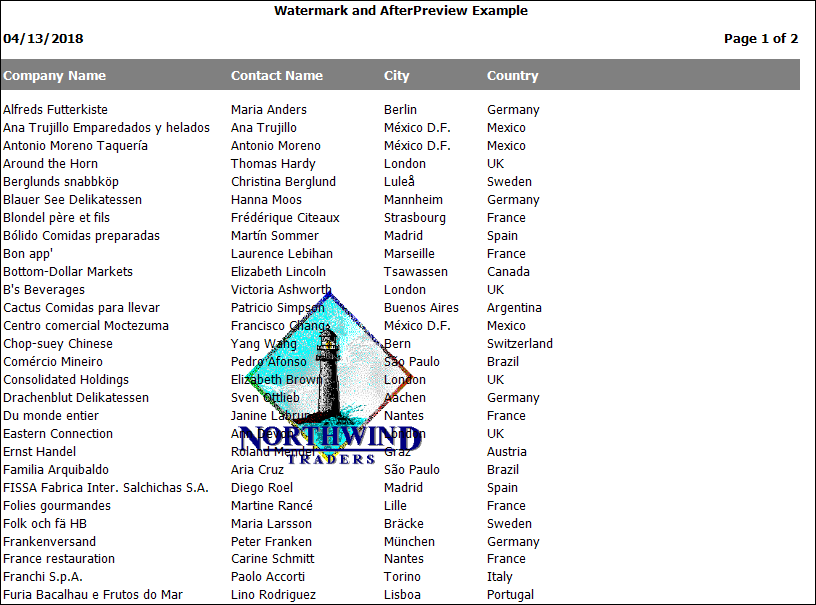
Sample ReportsGet started immediately with our sample reports! Stonefield Query comes with 40+ sample reports that can be run or used as a starting point for report design, and used with our Basic viewer program in runtime. |
Reporting Made SimpleStonefield Query walks you through the reporting process in 6 easy-to-follow steps so you can build professional reports in minutes, not days. |
Easily Report on Both Current and History RecordsIn any case where a table can be broken up in to a combination of "Current" and "History" items, the contents of each table are also available from a combined version, allowing you to combine the results of these separate physical tables into the same report seamlessly. |
Report on Custom FieldsCustom fields defined using the Custom Field Manager automatically appear in Stonefield Query with the same captions as they do in AccountMate. |
Module ReportingLimit users reporting to only modules they have access to and have been activated in AccountMate. |
Handles Code FieldsDisplays the expected value for many code fields rather than the actual values as AccountMate stores them so you don't have to figure out what those numeric values mean. |
Schedule and Automatically Deliver ReportsAutomatically deliver reports via e-mail, file, or printer. Schedule them to run anytime you need them to, and never miss a reporting commitment to your peers, customers, or vendors (requires Ultimate). |
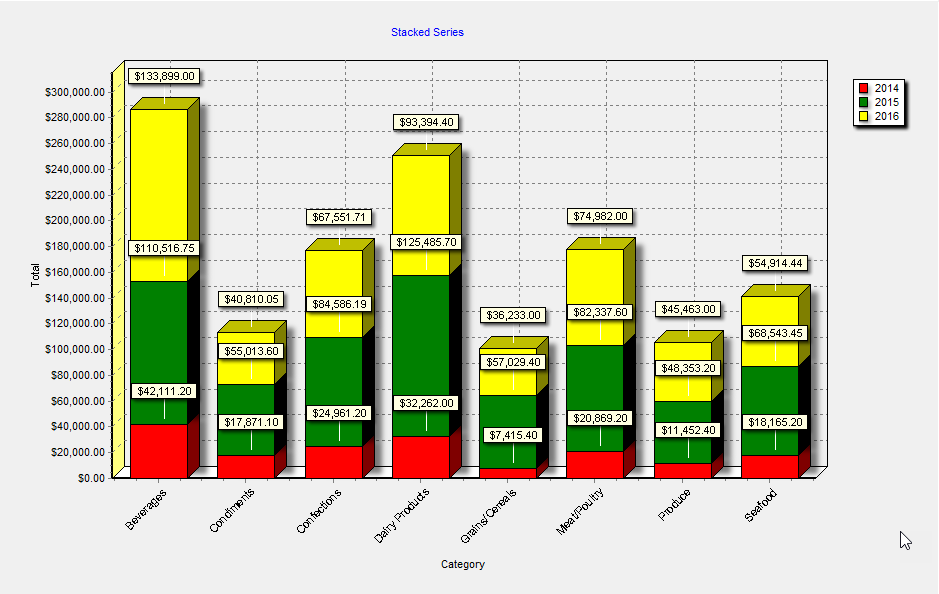
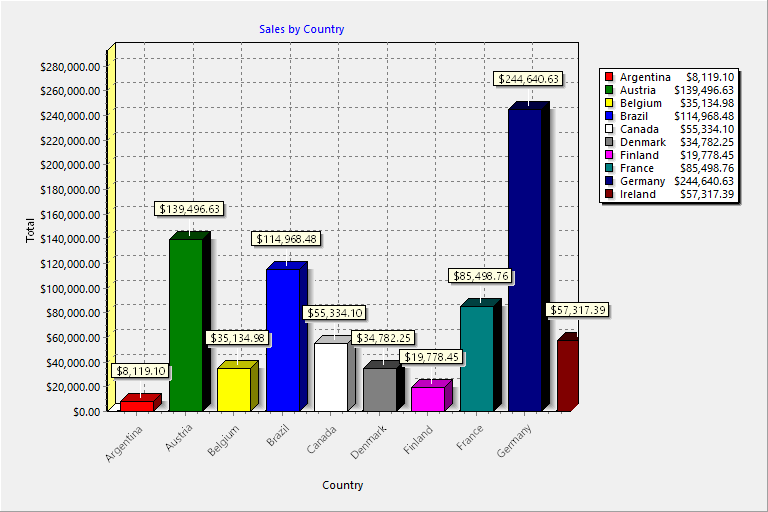
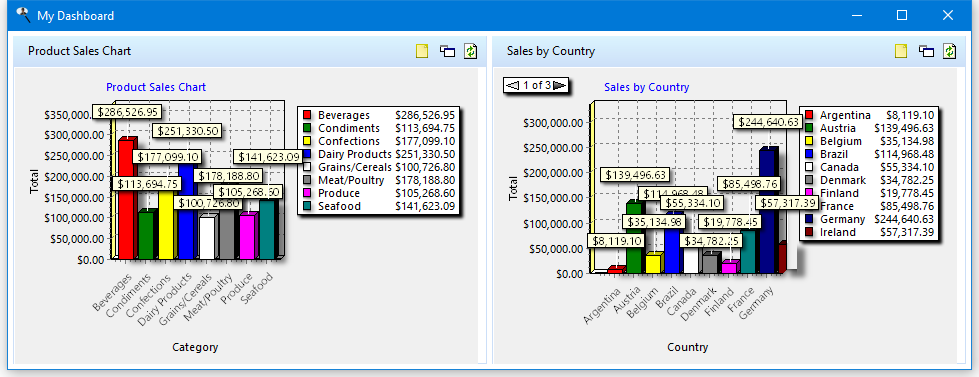
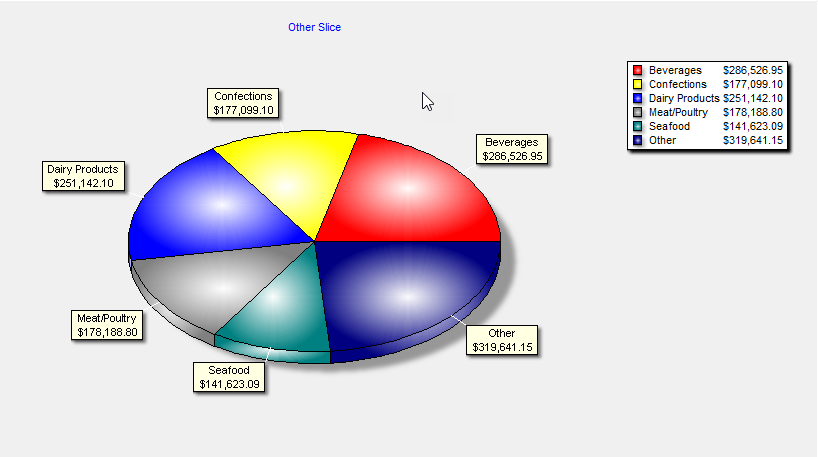
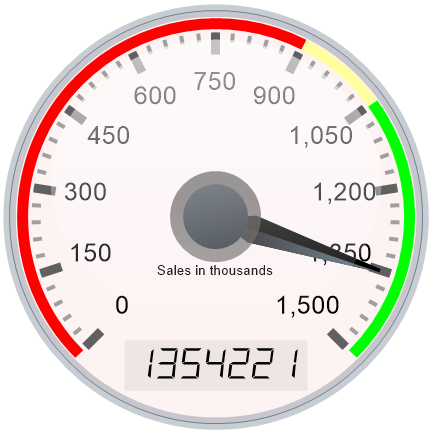
Charts, Graphs, and DashboardsCreate bar, line, area, and pie charts as well as series charts. Dashboards combine multiple charts into one consolidated view of your data. Zoom in and out on the dashboard, update individual reports manually, and output the dashboard to file. |
Microsoft Excel PivotTable ReportingExtend your data analysis with Microsoft Excel PivotTables. |
Create Your Own Custom FormulasDefine your own custom calculations to use in any report. Use any of the hundreds of built-in functions or create your own. |
Filters and ExclusionsFilters allow you to narrow down your results without programming, such as product sales by customer for this year, month, or week. Exclusions allow you to report on things not recorded in AccountMate, such as all companies that bought something last year but not this year. |
Multiple Database SupportYou can run reports on more than one AccountMate database. You can even consolidate records from multiple companies into one report (requires Ultimate). For example, you could show all outstanding invoices from all companies on the same report, including showing which company each one came from. |
Pricing
There are two types of licenses available:
- Ultimate (also known as "Report Designer"): this license includes all features. The price for the first license is $2,400 US ($3,260 Canadian) and subsequent licenses are $1,200 US ($1,630 Canadian). Ultimate licenses come with one Basic license at no additional cost.
- Basic (also known as "Report Viewer"): has all the features of an Ultimate license except the ability to create or edit reports (it can only run reports created by other users) and the ability to schedule reports. The price for a Basic license is $150 US ($205 Canadian).
Please note:
Software maintenance is 25% per year and is required with the initial purchase.
Basic licenses are available by subscription only and require software maintenance to be kept current.
System Requirements
- Any version of Microsoft Windows released after 2006: Windows Vista, Windows 7, Windows 8, Windows Server 2008, Windows Server 2012, Windows Server 2016, Windows Server 2019, Windows Server 2022, Windows Terminal Server, Windows Small Business Server, Windows Essentials Business Server (also works in Citrix environments)
- 512 MB minimum memory (more is better)
- 50 MB free hard disk space
- Scheduled reports are not available in Citrix environments.
- Stonefield Query for AccountMate works with the latest version of AccountMate SQL and earlier versions.
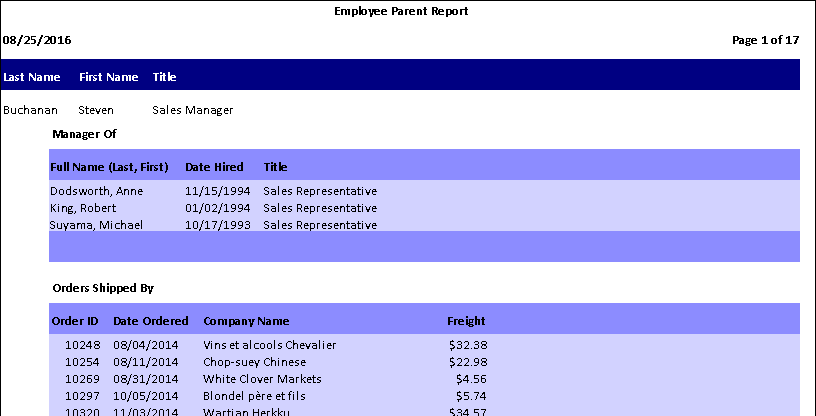
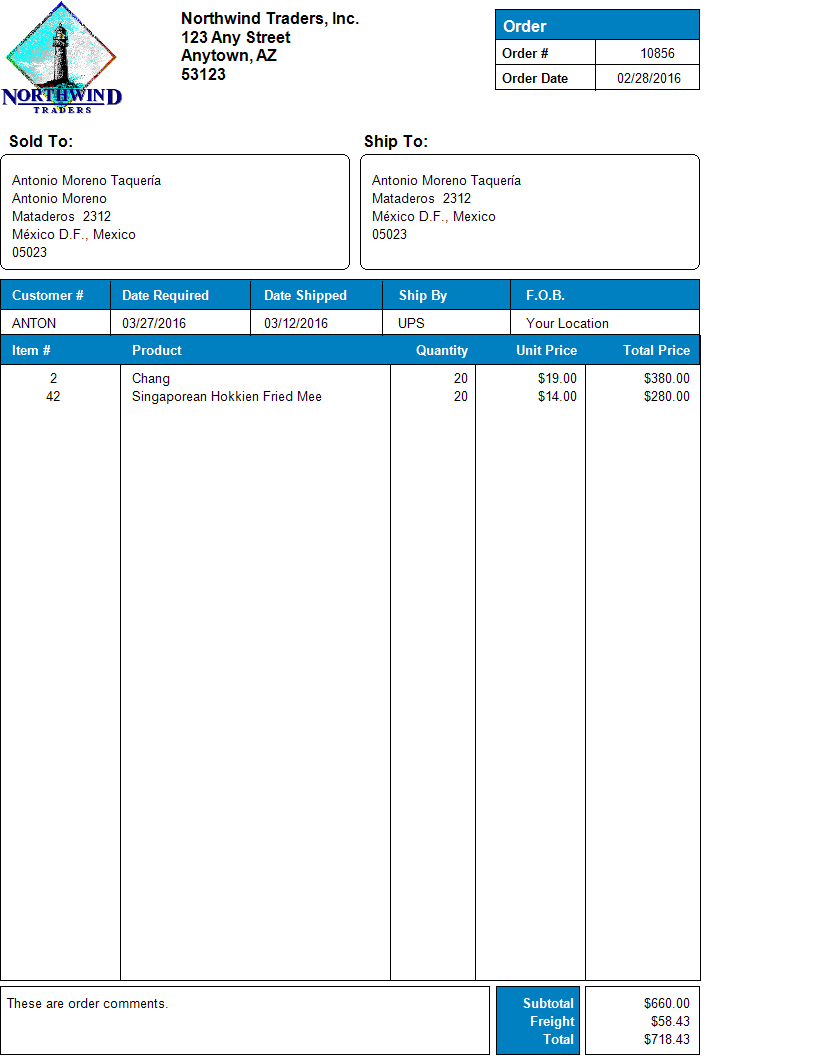
Sample Reports